Tag: <span>infographics</span>

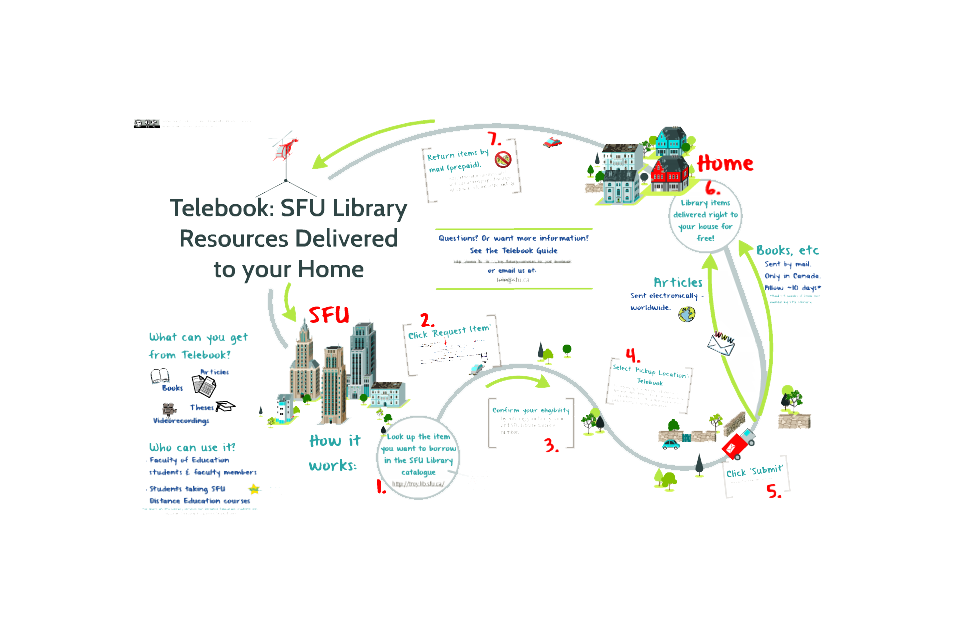
Telebook Infographic & ‘Meet Your Librarian’ Video

  The Telebook infographic is an interactive infographic meant to give a quick, engaging visual overview to the Telebook service.  The existing screen capture tutorial is becoming outdated and I wanted an alternative way of delivering the information in a sustainable way – so easy to update, low time commitment, …

Shivanand Balram

Shiv Balram from the Geography dept. wanted to create some practical case study resources for his students that would provide alot of information, in an easily digestible, and mobile form.  For his EMP project he chose to work on some custom infographics that could be shared with his students, and dove …

Infographic on Community Growth in the Tri-Cities, British Columbia

Description: This asset provides a recent snapshot of the population and land-use changes that characterize the Tri-Cities region, Metro Vancouver, British Columbia. Population density is calculated in two ways – first, using the total land surface area; and second, using only the residential land-use area. These two representations of density …

Infographic on Global Water Use and Water Wars

Description: This asset is a summary of the water use situation for the planet. It uses a systems approach to map the key stages of water availability, water usage and water consequences. Of particular importance is the impact of water scarcity and inaccessibility, and the use of technologies to manage …