
A Wordle graphic is a useful visual means to summarize discussions. Below is a summary of 800+ postings from 1200 students to the course question:
Can a GIS database produce an accurate representation of the real world? If yes, then how do we properly address concerns with GIS such as privacy and inequality. If no, then how do we improve our GIS so that it represents reality more accurately.
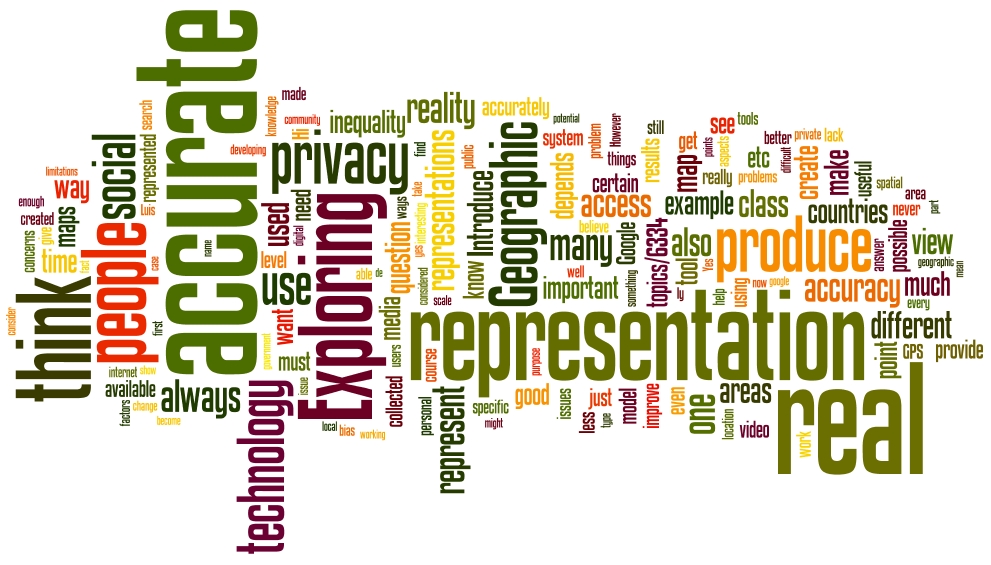
The graphic clearly shows the concepts that contributors consider to be important aspects of the question being asked.